Grafana Dashboard
Once the data is in InfluxDB it is easy to graph in Grafana. Grafana cannot query MongoDB, so InfluxDB persistence has to be enabled for this — see the configuration page. If you enabled InfluxDB after already having exported data, migrate the existing data first instead of re-exporting it: POST /api/v2/migration/toInfluxDb.
You can use my dashboard as a starting point or build your own.
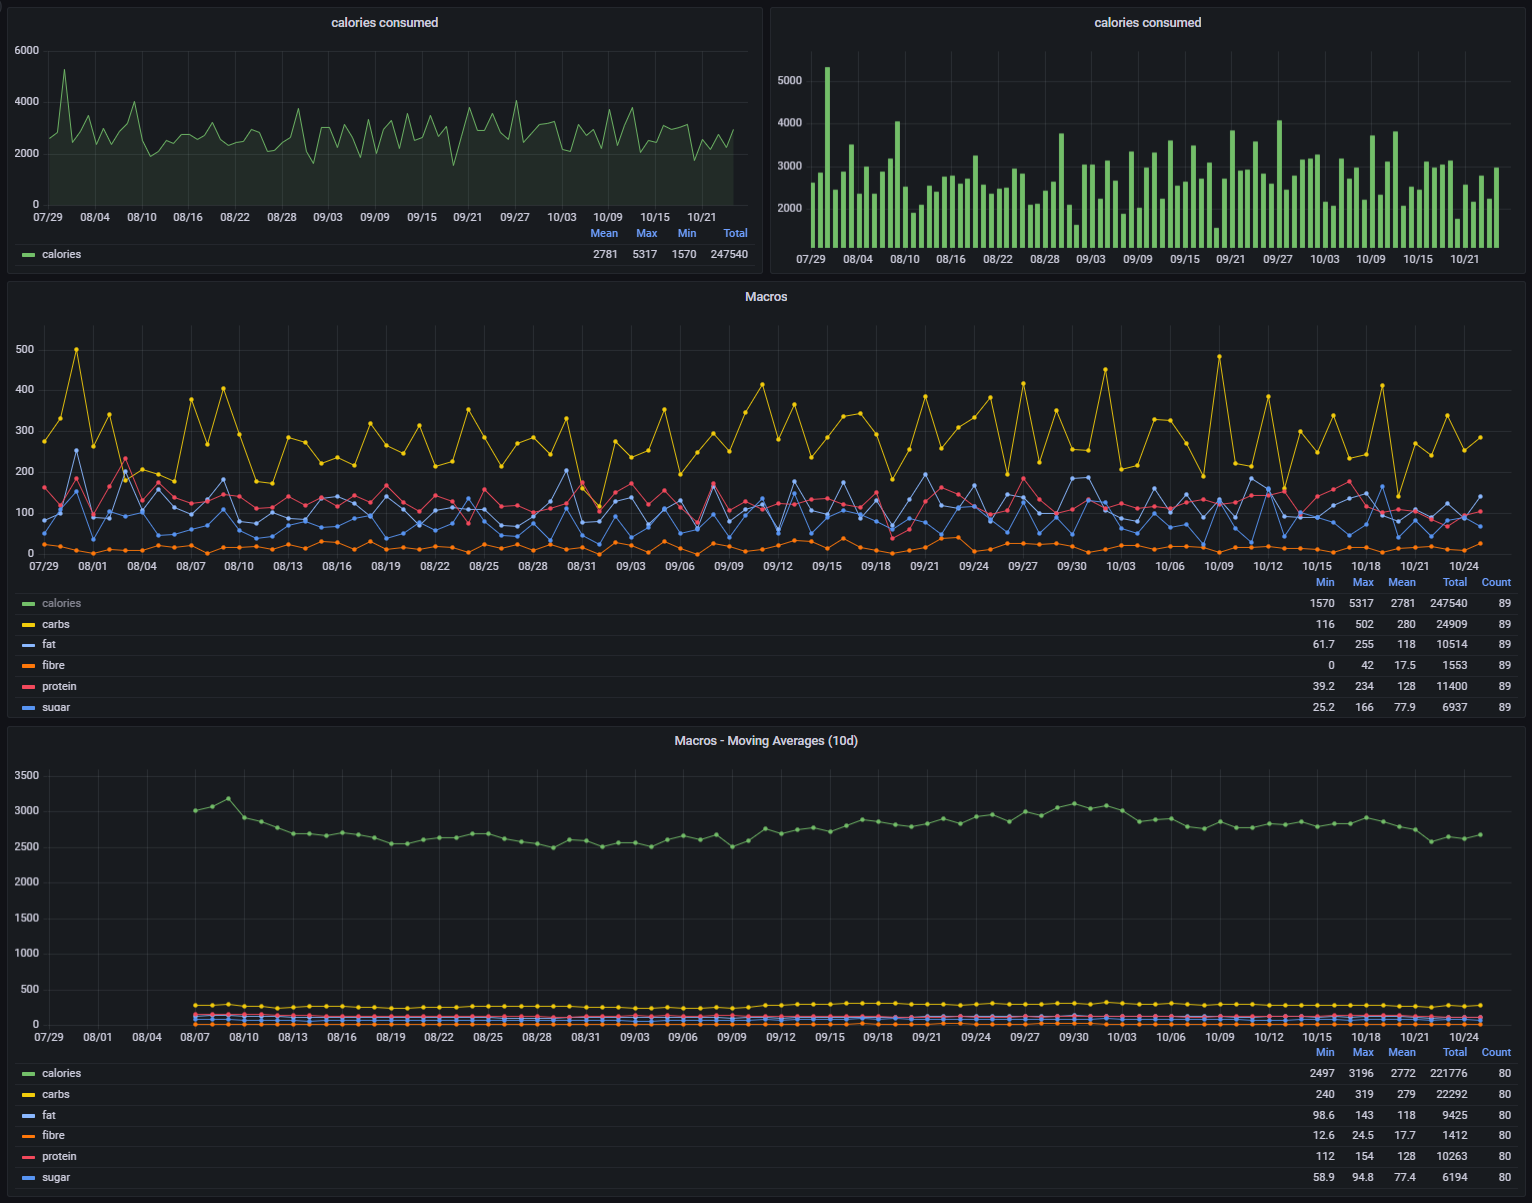
What the panels expect
The exporter writes one measurement, with one field per nutrient:
| Bucket | fddb-exporter — whatever FDDB-EXPORTER_INFLUXDB_BUCKET is set to |
| Measurement | dailyTotals |
| Fields | calories, fat, carbs, sugar, protein, fibre |
| Timestamp | midnight of the diary day, in the configured timezone, stored as UTC |
Calories are kcal, everything else is grams. Only daily totals are stored — individual products stay in MongoDB, so a "what did I eat" panel is not possible from InfluxDB alone. There are no tags, so nothing to group by beyond the field name.
A minimal Flux query for one nutrient:
from(bucket: "fddb-exporter")
  |> range(start: v.timeRangeStart, stop: v.timeRangeStop)
  |> filter(fn: (r) => r["_measurement"] == "dailyTotals")
  |> filter(fn: (r) => r["_field"] == "calories")
  |> aggregateWindow(every: v.windowPeriod, fn: mean, createEmpty: false)
Importing the bundled dashboard
The dashboard queries in Flux, so the InfluxDB data source has to be configured with Flux as its query language (not InfluxQL) and pointed at your InfluxDB 2.x org and bucket.
- Download
grafana-dashboard.json. - In Grafana, go to Dashboards → New → Import and upload the file.
- Pick your InfluxDB data source when Grafana asks. The exported JSON still carries the data source UID from my own instance, so if Grafana does not prompt you, open each panel afterwards and select the data source there.
- If your bucket is not named
fddb-exporter, edit the bucket name in each panel's query — the name is written into the Flux query itself, which no data source setting can override.
The dashboard contains four panels: calories over time (twice, at different time ranges), all macros together, and a 10-day moving average of the macros. It was exported from Grafana 9 (schemaVersion: 37); newer Grafana versions import it and migrate the schema on the way in.
No data in the panels?
- Confirm the exporter is actually writing points:
/api/v2/statsreports the number of stored entries, and the startup log names the persistence layers in use. - Check the time range. The scheduler exports yesterday, so a dashboard defaulting to "last 6 hours" is empty by design — widen it to at least a few days.
- A day you never logged has no point at all rather than a zero, so gaps in a line are expected. Use the Missing Days view or
/api/v2/stats/missing-daysto see which days those are. - See Troubleshooting if nothing is being written at all.