Web UI
The FDDB Exporter includes a built-in web interface powered by Vaadin / Hilla, providing a modern and intuitive way to interact with all features of the application directly from your browser.
Overview
The web UI offers a complete graphical interface for all FDDB Exporter features. All functionality available through the REST API can also be accessed through this user-friendly interface, making it easier to manage your nutritional data without needing to make API calls directly.
Features
The web interface provides access to all core features:
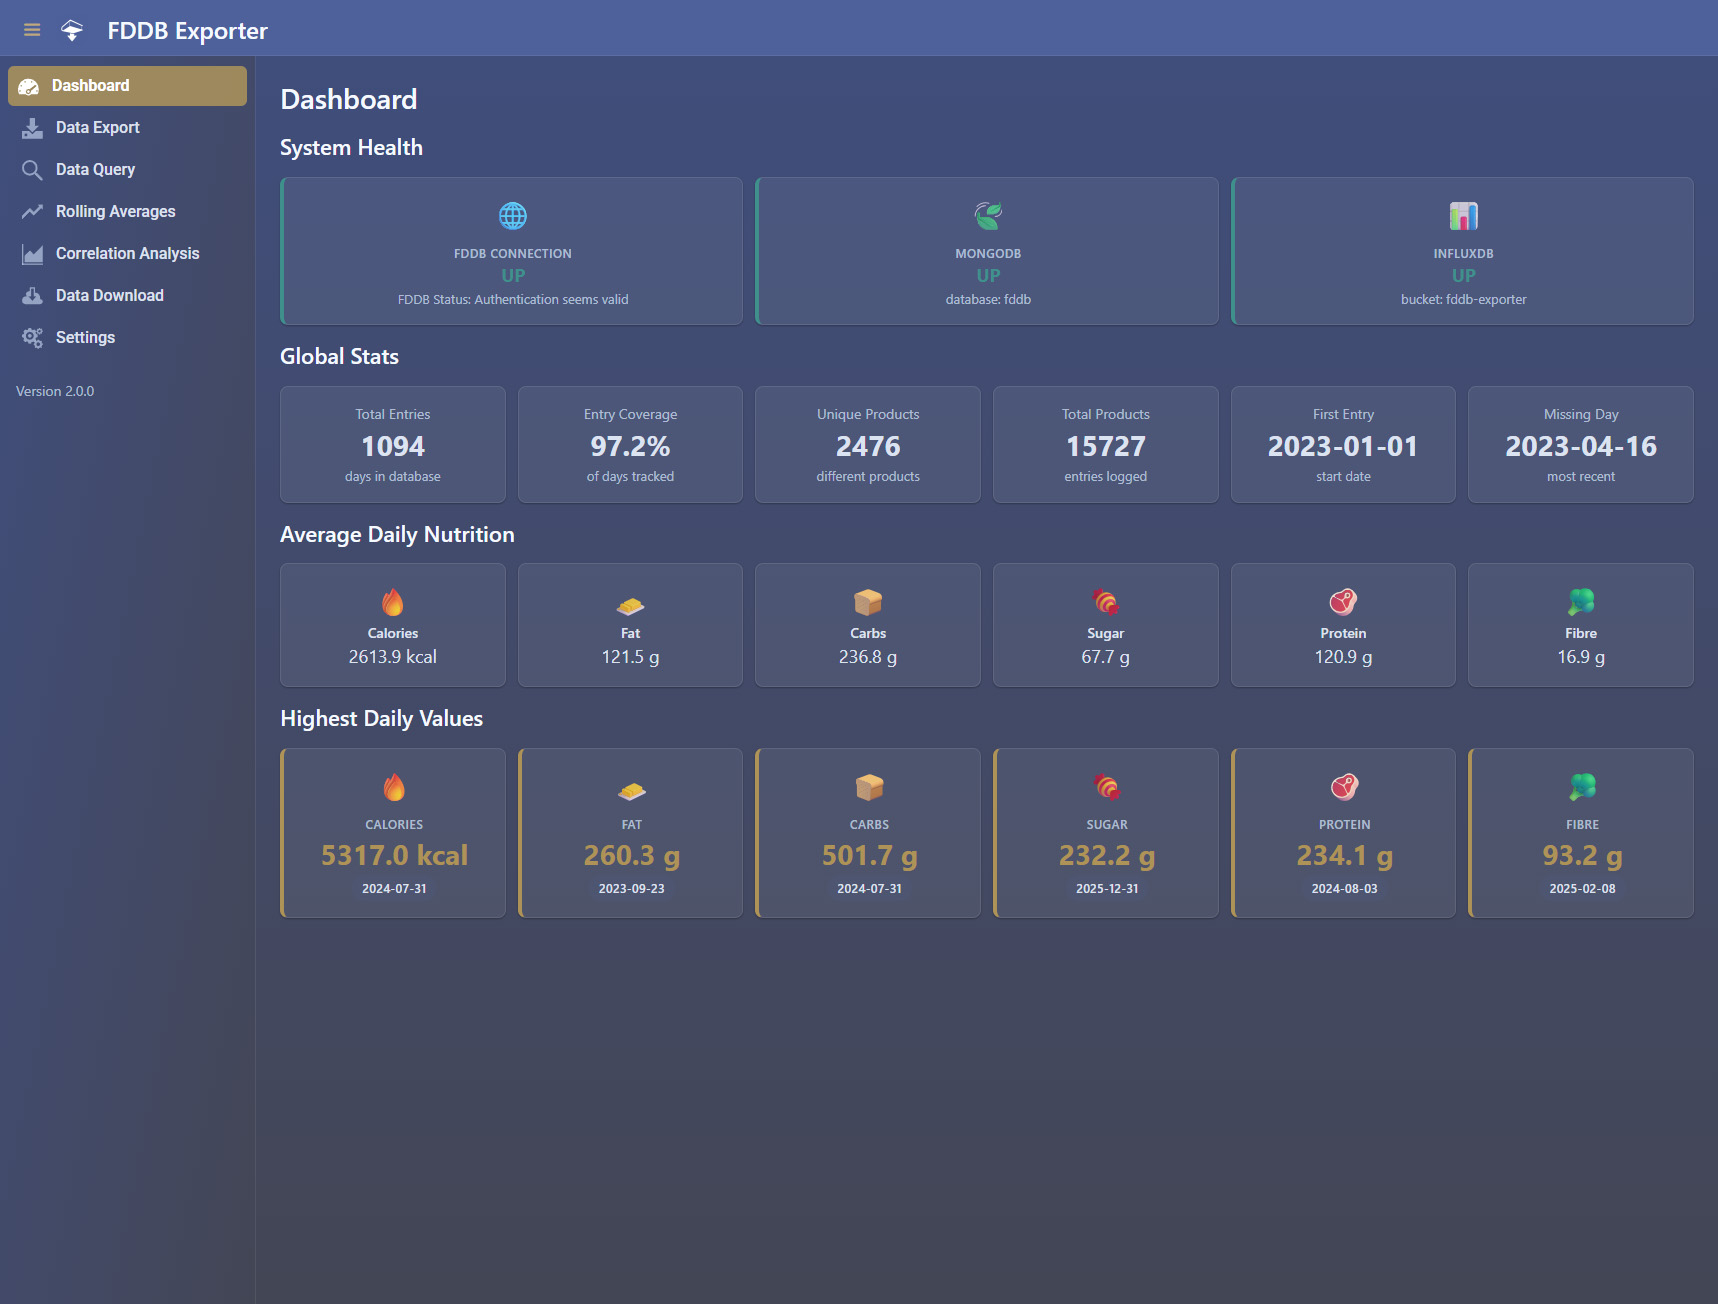
- Dashboard: View your nutritional statistics at a glance
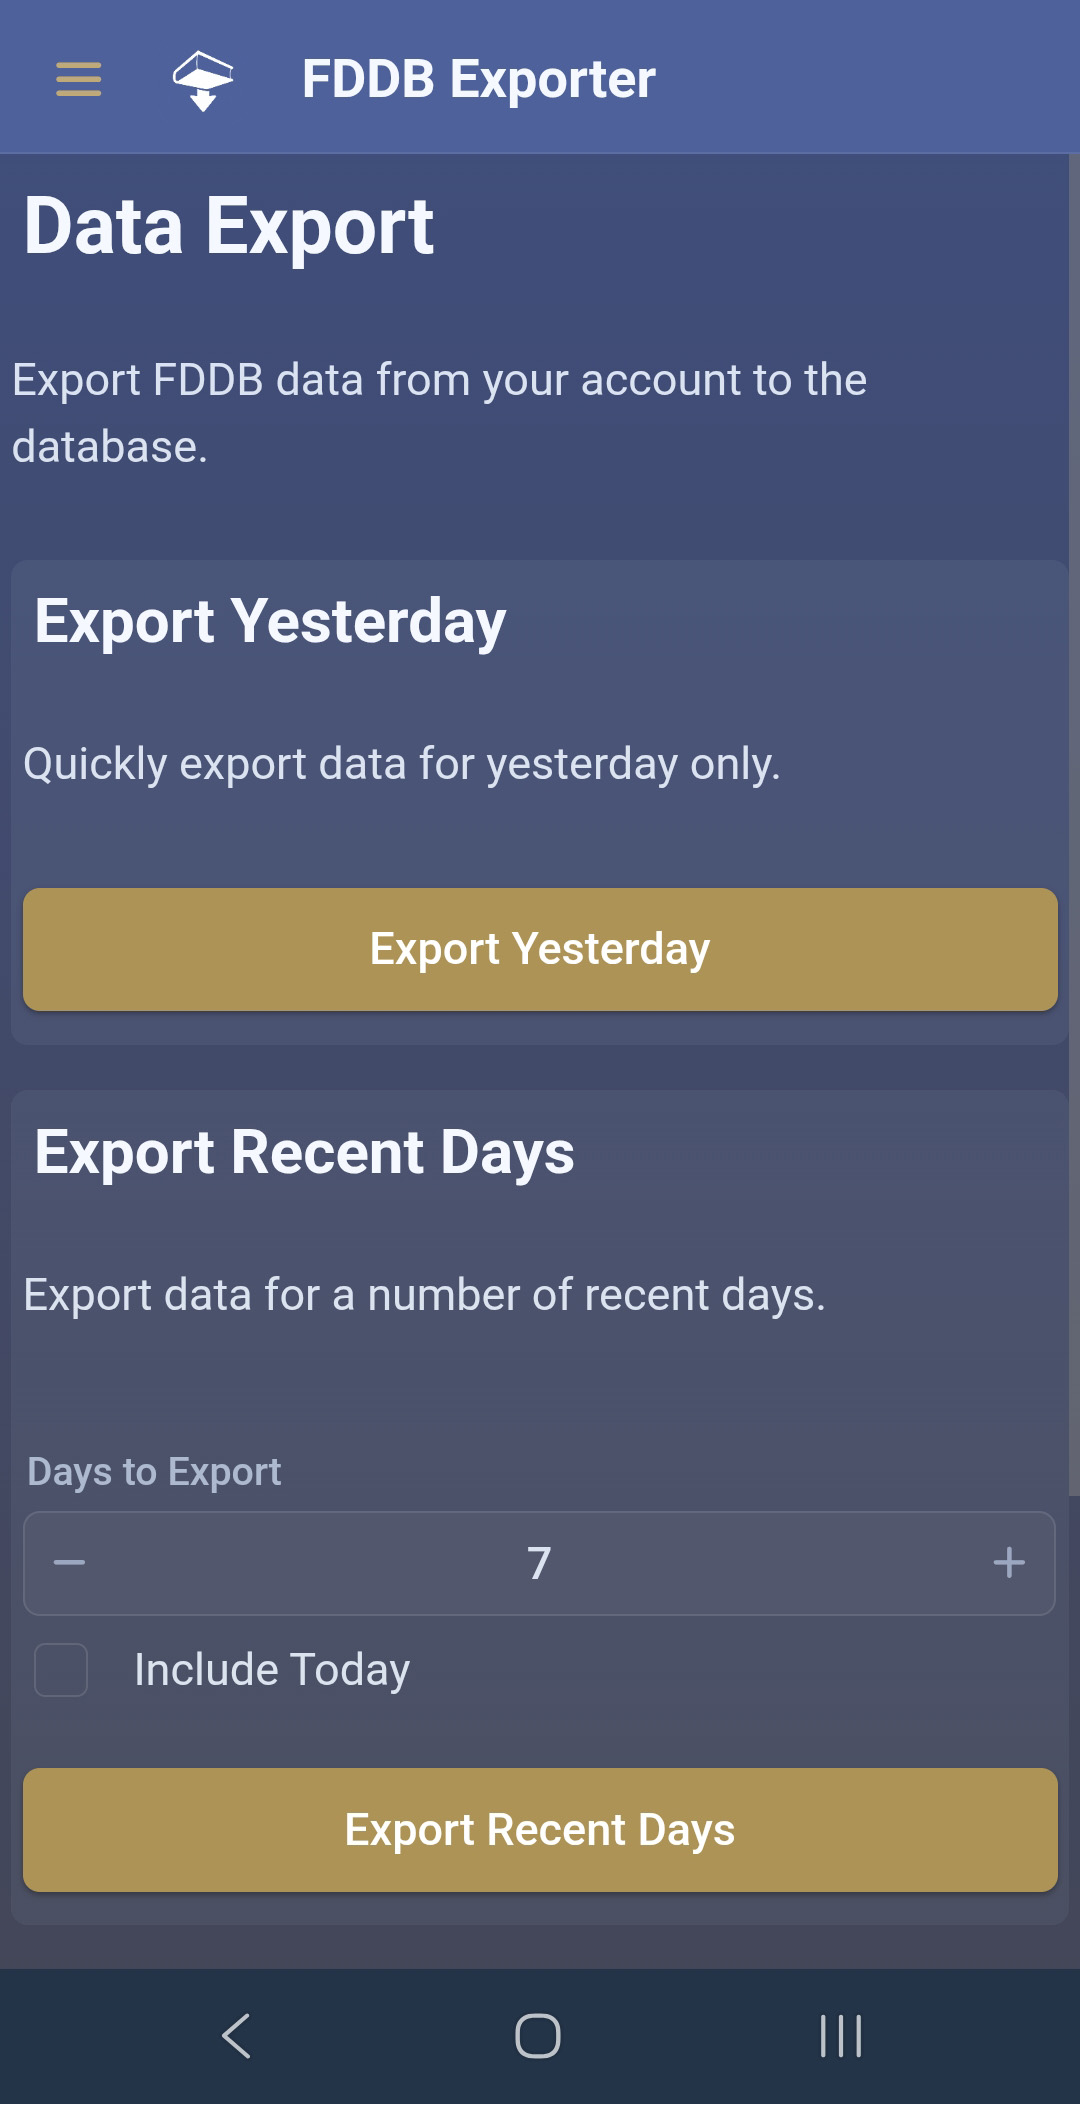
- Export Data: Manually trigger data exports for specific date ranges or recent days
- Entries: Look up nutritional data for any specific date or a whole date range, browse all stored entries, and list Missing Days — every day in a range with no entry — so gaps in your logging are easy to spot
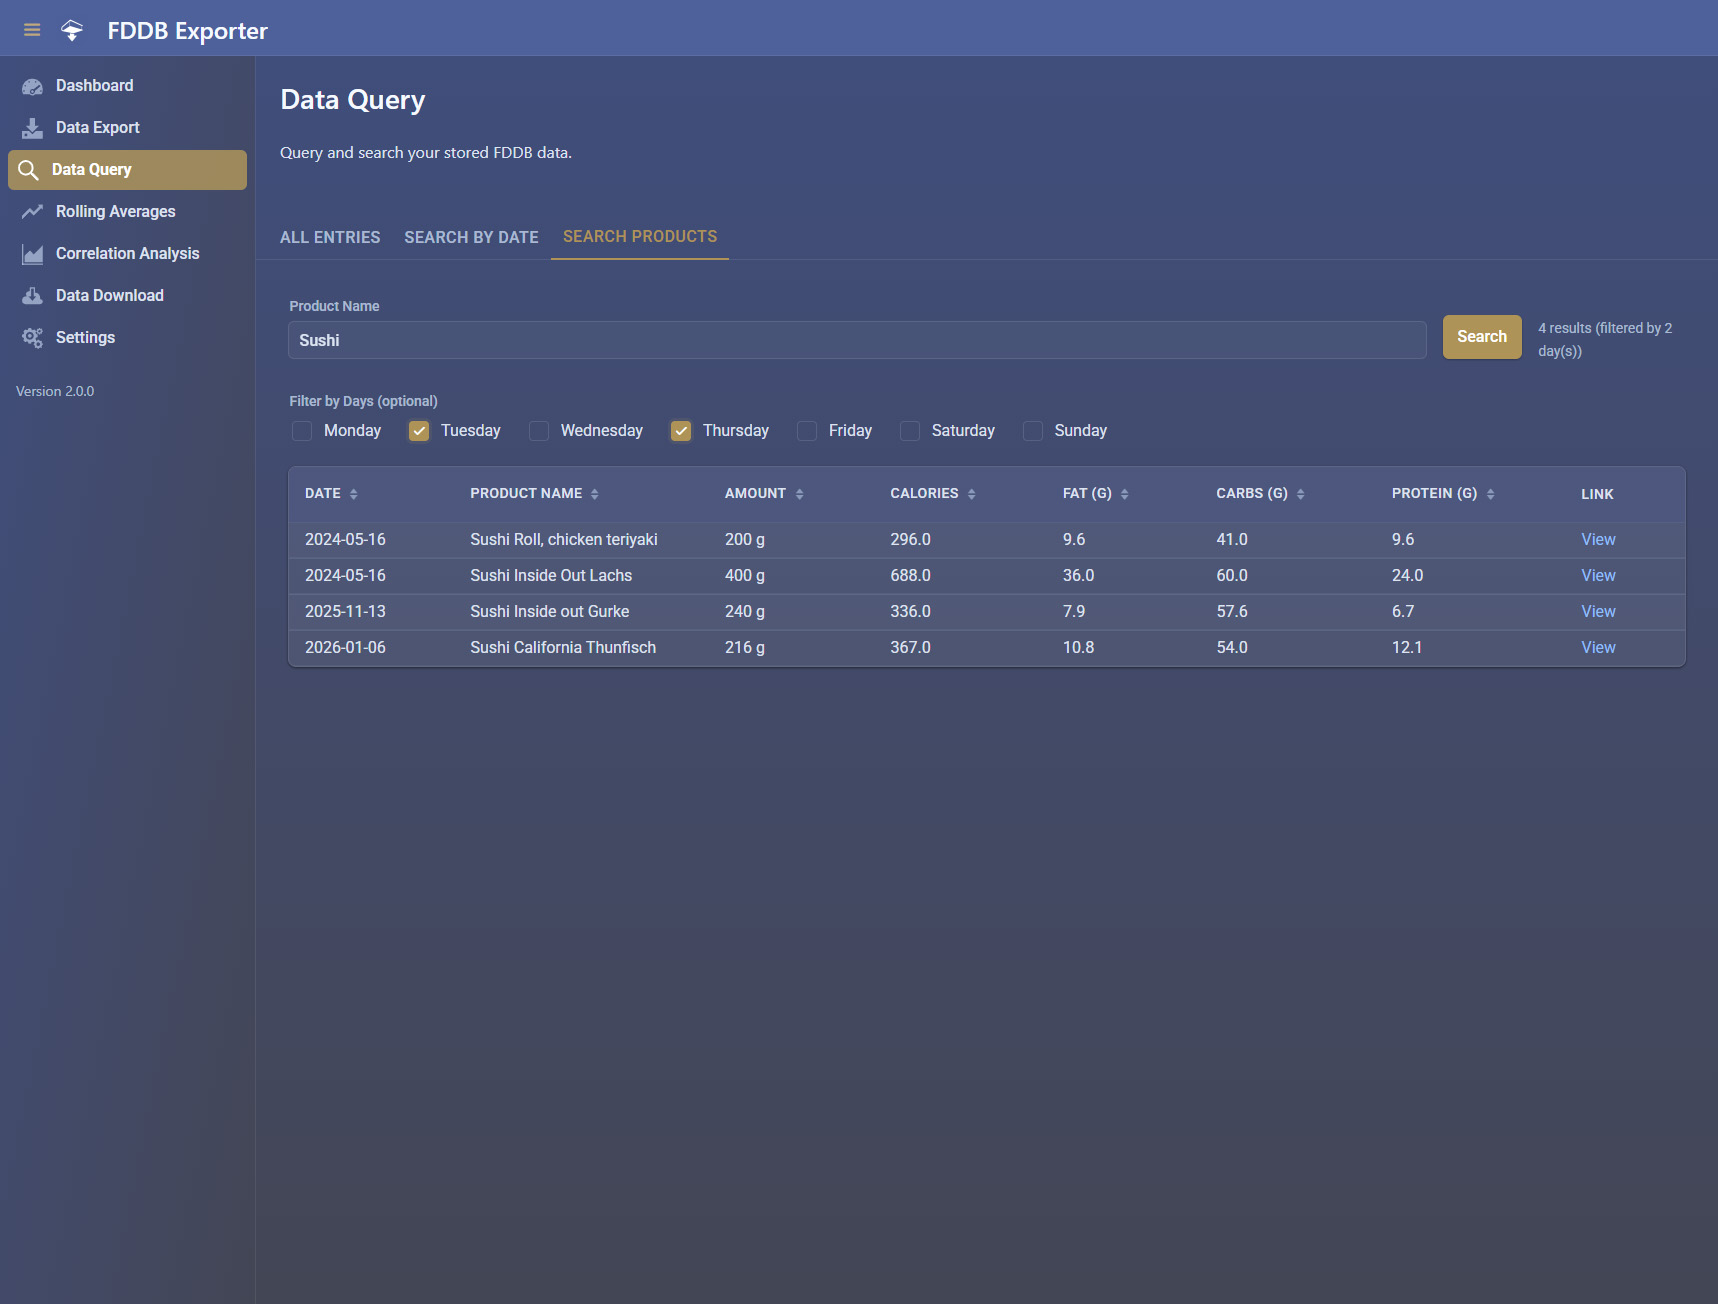
- Products: Explore a single product across your history and rank the products you log most (see Products below)
- Statistics: View comprehensive statistics including averages, highest values, entry coverage, and current/longest logging streaks
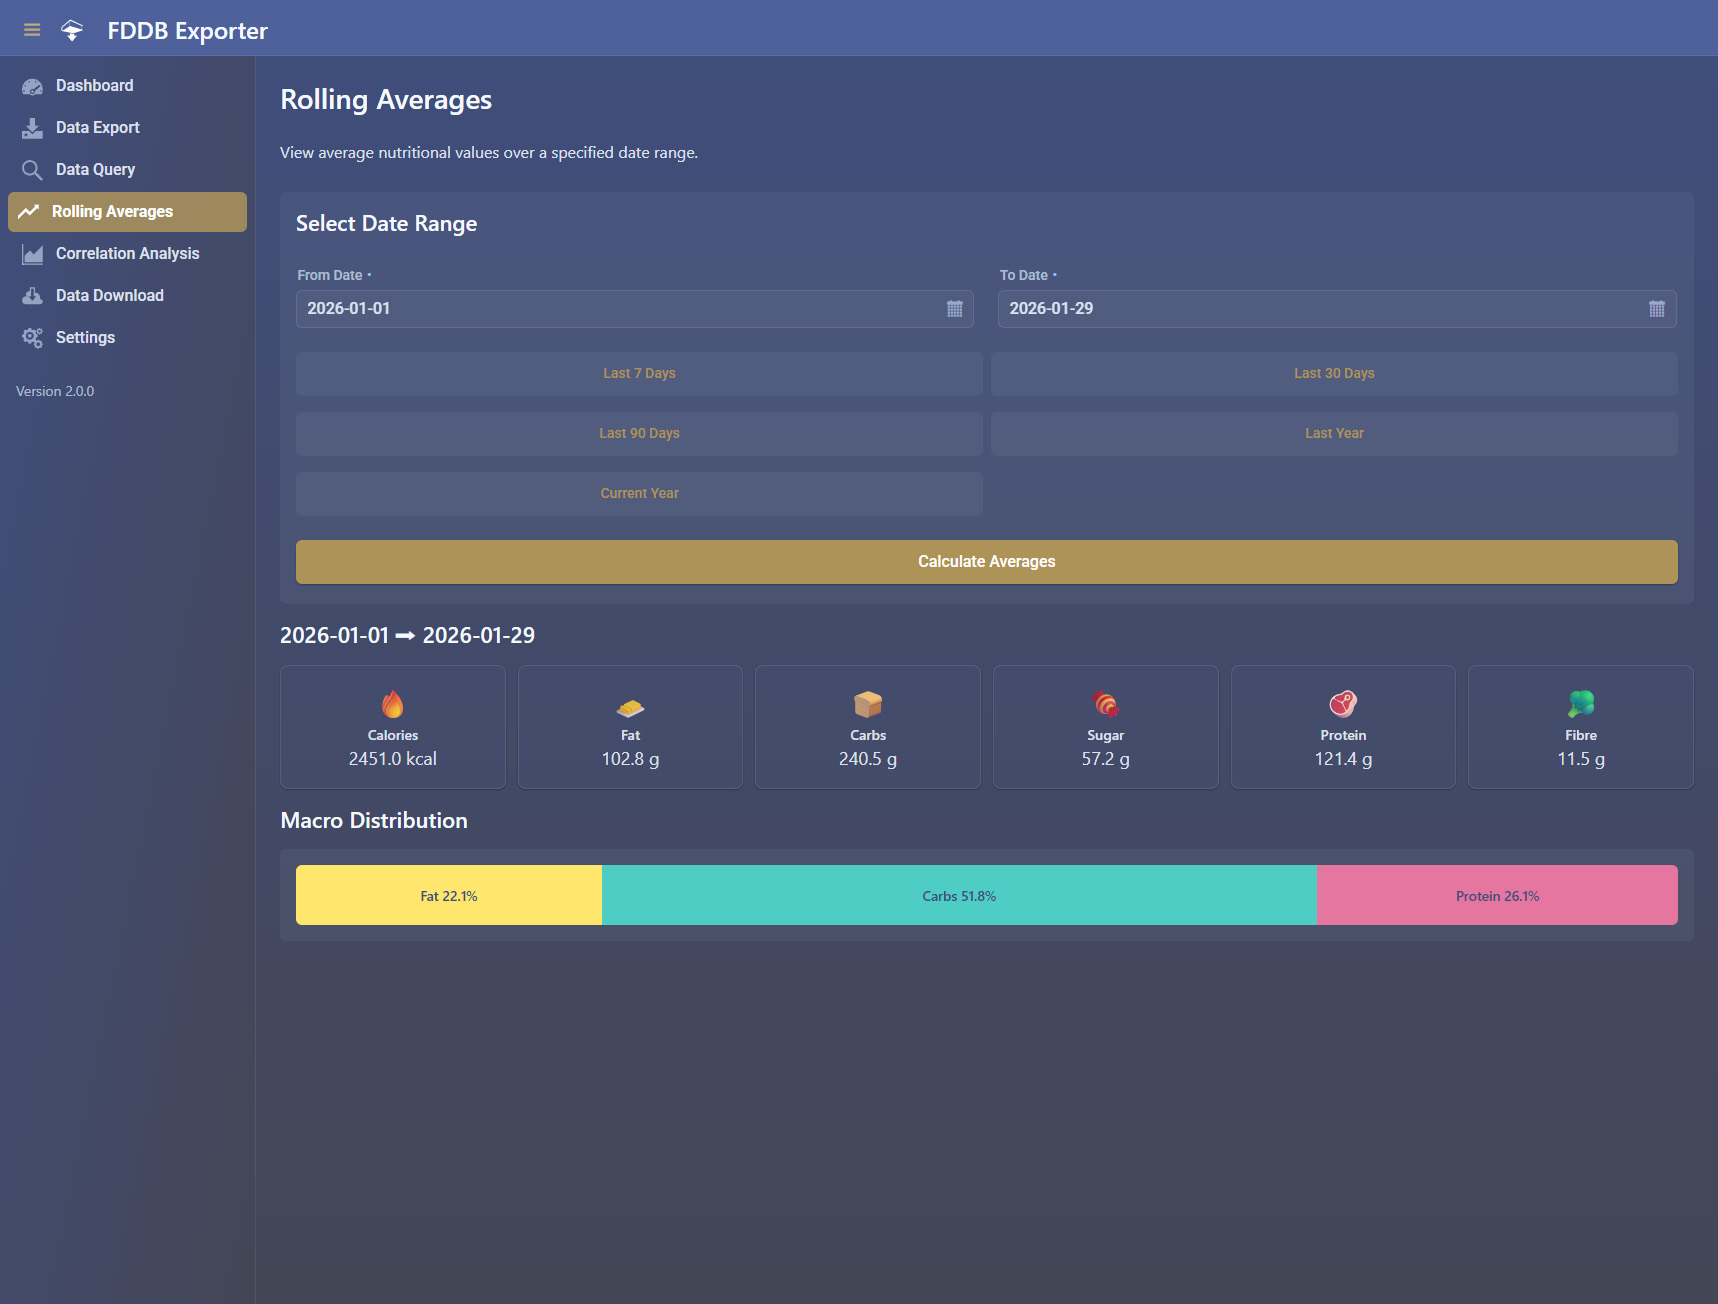
- Rolling Averages: Calculate averages for custom date ranges, including a macro split and a by-day-of-week breakdown
- Trends: Chart a single metric over time, bucketed by day, ISO week or month
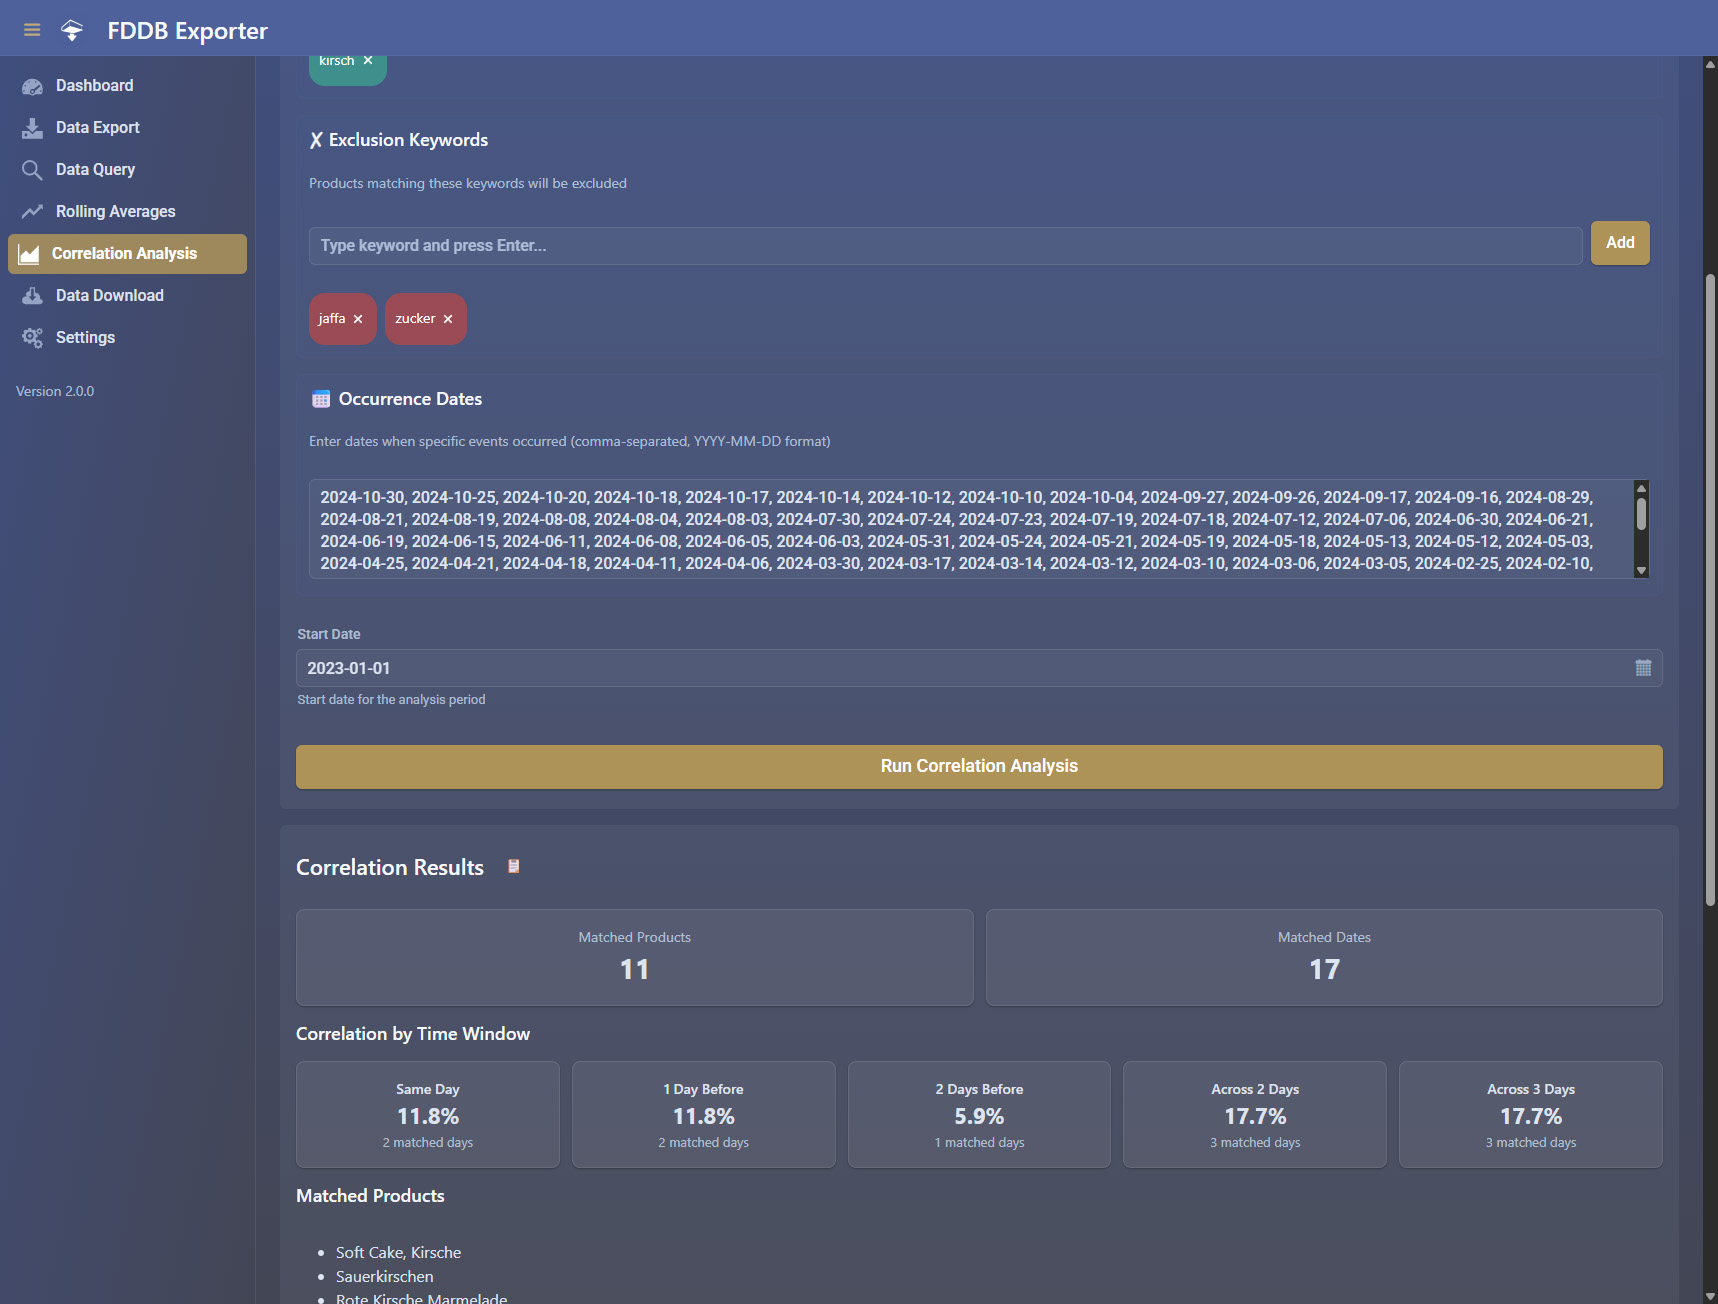
- Correlation Analysis: Analyze correlations between products and specific dates to identify potential food sensitivities
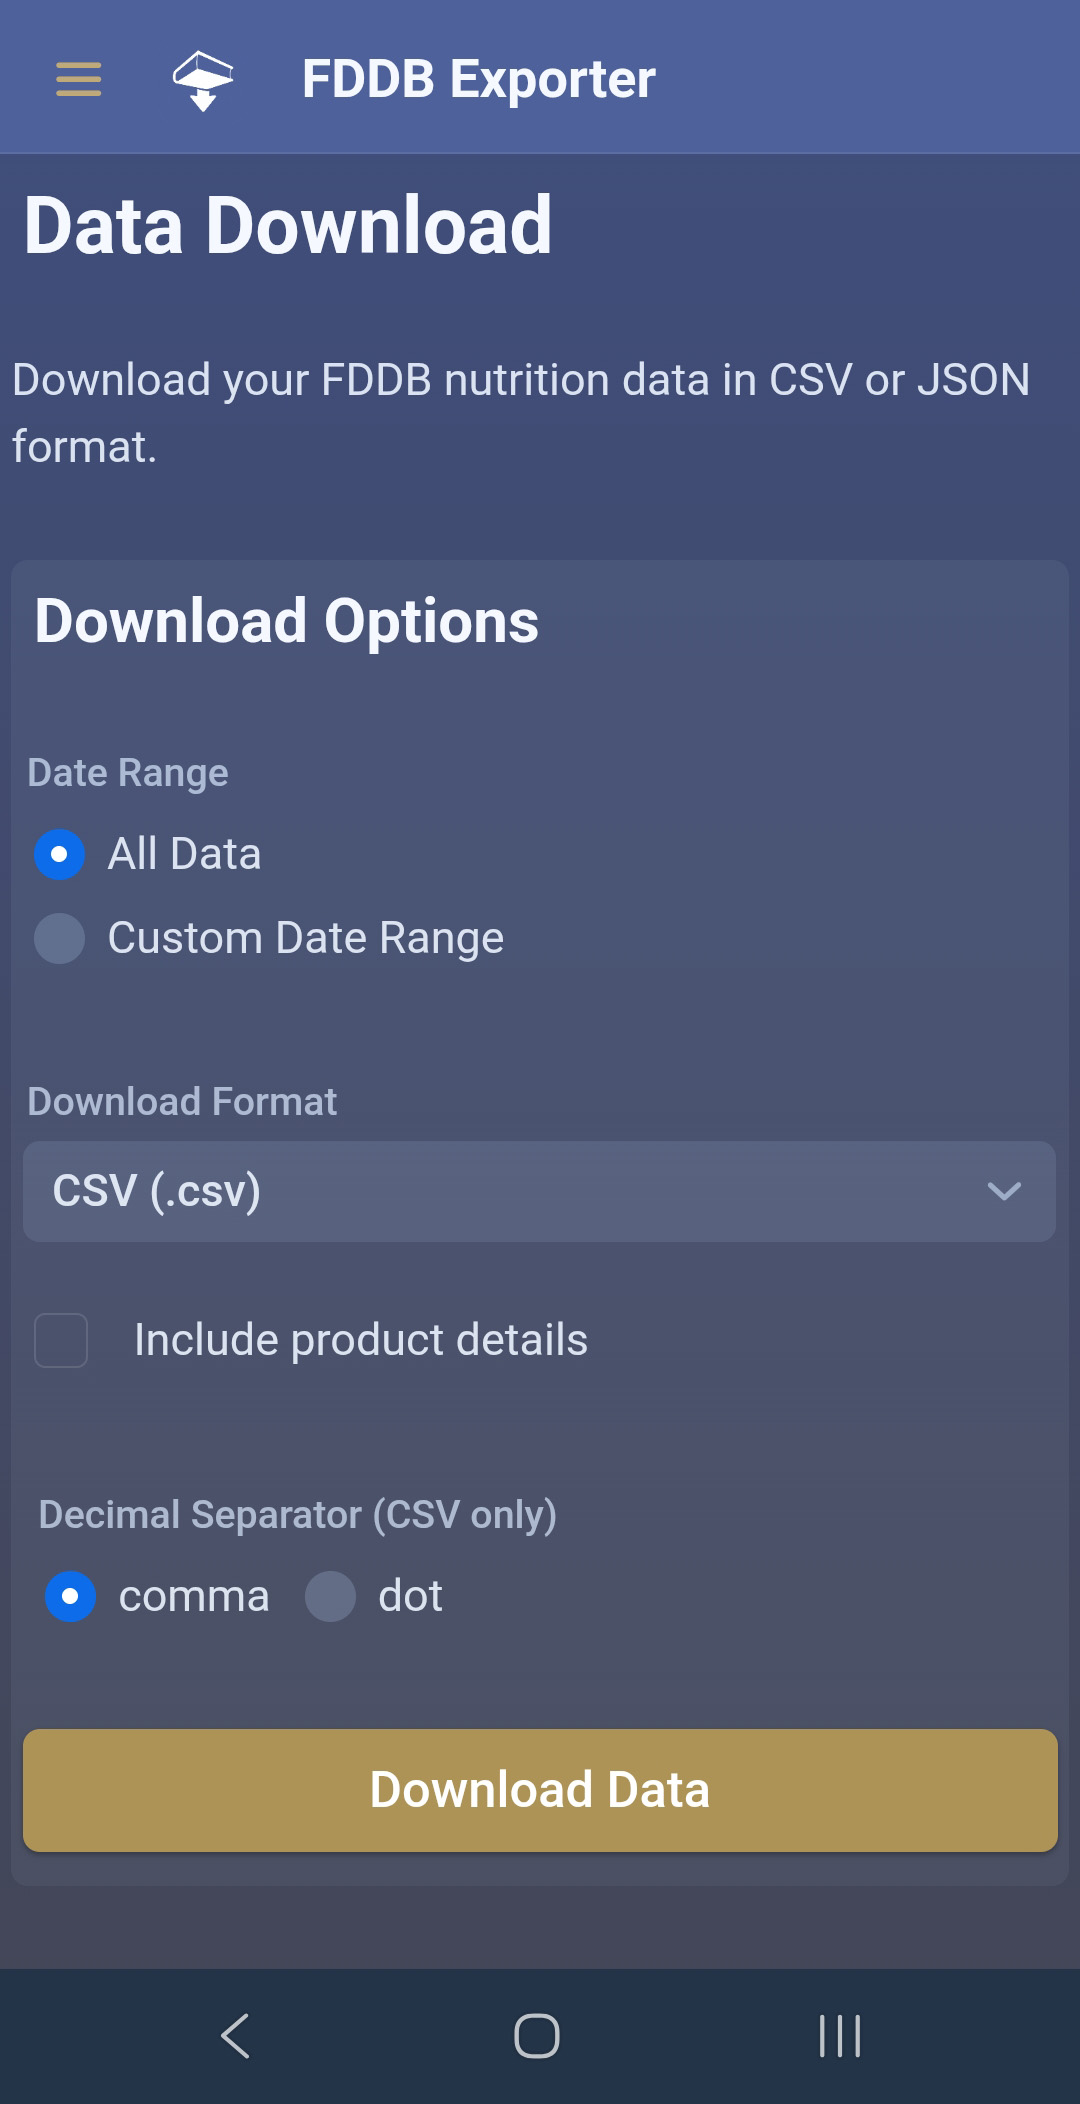
- Download Data: Export your data in CSV or JSON format with customizable options
Screenshots
The following screenshots showcase several pages of the FDDB Exporter web interface for demonstration purposes. Both desktop and mobile versions provide the same features and functionality - the differences shown below are purely visual adaptations for optimal display on different screen sizes.
INFO
The screenshots below were taken with version 2.1.0 and do not show features added since then — for example the Trends view introduced in 2.3.0. The current UI may differ in details.
Desktop Views
| Dashboard | Product Search |
|---|---|
 |  |
| Rolling Averages | Correlation Analysis |
 |  |
Mobile Views
| Data Export | Download |
|---|---|
 |  |
Feature Details
Products 2.3.0+
The Products view collects everything product-centric into one place, split across two tabs.
Explorer
The Explorer tab answers "tell me everything about this product" from a single search box:
- Start typing a term (e.g.
hafer). The box autocompletes with the exact, brand-prefixed names FDDB actually stores (Haferflocken kernig,Haferflocken zart, …), so you don't have to remember the precise wording. - Pick a suggested name for an exact match, or just type any term to aggregate every product whose name contains it.
- Optionally set a From/To date range — it narrows both the summary and the occurrences below.
The result is shown at two levels of zoom:
- Summary cards — how often the product was eaten, the first and last date it was logged, the average calories per occurrence, and the totals it contributed (calories, fat, carbs, protein)
- By day of the week — a small bar chart showing how the occurrences distribute across weekdays, so you can spot, say, a weekend treat at a glance. Click a day's bar to filter the occurrences below to that weekday (click again to clear, or click several days to combine them). This answers "I ate sushi on a Thursday — which Thursdays?" without a separate search.
- Occurrences table — every individual logging of the matching products with its date (including the weekday) and nutritional values; clicking a row jumps to that day in the Entries view
Top Products
The Top Products tab ranks products by how often they were logged or by the calories, fat, carbs or protein they contributed, over an optional date range and up to a configurable limit. Clicking a ranked product drills straight into the Explorer tab for its full profile.
Rolling Averages
The Rolling Averages view allows you to calculate average nutritional values over any custom date range. This is useful for analyzing your nutritional patterns over specific periods.
Quick-Select Buttons
The view includes several preset buttons for common time periods:
- Last 7 Days — Averages for the past week
- Last 30 Days — Averages for the past month
- Last 90 Days — Averages for the past quarter
- Last Year — Averages for the past 365 days
- Current Year — Averages from January 1 to yesterday of the current year
Custom Presets 2.1.0+
You can also create custom date range presets that will appear as additional quick-select buttons:
- Navigate to Settings in the menu
- Scroll to the "Rolling Average Presets" section
- Enter a name for your preset (e.g., "Q1 2025", "Summer 2024")
- Select the From Date and To Date for your custom range
- Click "Add Preset"
Once saved, your custom preset will appear as a button on the Rolling Averages view, allowing you to quickly calculate averages for that date range with a single click. To create a custom preset which tracks to the current date, simply set the To Date to a future date (e.g., December 31, 2030). This way, the preset will always calculate averages up to yesterday's date, making it ideal for tracking ongoing periods like the current quarter or year.
Example use cases for custom presets:
- Compare quarterly performance (Q1, Q2, Q3, Q4)
- Analyze seasonal patterns (e.g., "Summer 2024", "Winter 2023")
- Track specific project or diet phases (e.g., "Keto Phase 1", "Training Period")
Results
After selecting a date range and clicking Calculate Averages, the view displays:
- Individual nutrient cards — Average values for calories, fat, carbs, sugar, protein, and fiber
- Macro distribution bar — Visual representation showing the kcal-weighted percentage breakdown of macronutrients (fat, carbs, protein) in your average daily intake
- By Day of the Week — A table breaking the same date range down by day of the week, so you can see at a glance whether weekends differ from weekdays
Trends 2.3.0+
The Trends view charts one metric — calories, fat, carbs, sugar, protein or fibre — over a date range, bucketed by day, ISO week or month. Where Rolling Averages answers "what was my average over this range?", Trends answers "is that average moving?".
Pick a Metric, a Granularity and a date range, then click Show Trend. The quick-select buttons preset both the range and a granularity that suits it (Last 30 Days daily, Last 90 Days and Last Year weekly, Current Year monthly).
The results consist of:
- Summary cards — number of buckets, days logged, the daily average across the whole range, the highest and lowest bucket, and the change from the first to the last bucket
- Column chart — one column per bucket, scaled to the highest bucket, with a dashed line marking the overall daily average; hovering a column shows its exact value and how many days it covers
- Bucket table — every bucket with its date range, day count, average and total
Buckets without a single entry are omitted, so unlogged days never drag an average down. Use the Missing Days tab of the Entries view to find those gaps.
Mobile Support
The web UI is fully responsive and works seamlessly on mobile devices. You can access all features from your smartphone or tablet with the same functionality as on desktop.
Progressive Web App (PWA)
The FDDB Exporter web UI can be installed as a Progressive Web App (PWA) on your device for easier access. This may only work if you are accessing the web UI over HTTPS.
On Mobile (iOS/Android):
- Open the FDDB Exporter URL in your mobile browser
- Tap the browser menu (share icon on iOS, three dots on Android)
- Select "Add to Home Screen" or "Install App"
- The app will be added to your home screen for quick access
On Desktop (Chrome/Edge):
- Open the FDDB Exporter URL in your browser
- Look for the install icon in the address bar (or use the browser menu)
- Click "Install" to add it as a standalone application
Once installed as a PWA, you can launch the FDDB Exporter like any other app on your device, with faster loading times and an app-like experience.
Accessing the UI
The web interface is available at the root URL of your FDDB Exporter instance:
http://localhost:8080/Simply navigate to this URL in your browser after starting the application.
Version Updates
The web UI includes an automatic version check feature. When a new version of FDDB Exporter is available, a notification will appear in the sidebar menu and in the logs.
This helps you stay up to date with the latest features and improvements.